As a support engineer, we often receive requests for usage, audit, or monitoring reports for Power BI Report Server. Sometimes, there are support requests, users could easily self-resolve themselves if they would just have the right tool. For Power BI Service there are audit and monitoring templates available, but for Power BI Report Server there is not much or at least to my knowledge nothing publicly available.
Hence, that’s why I hope the following work in progress pbix will be beneficial to you: https://github.com/KornAlexander/PBI-Tools/blob/main/PBIRS/PBIRS%20Monitoring.pbix
The report consists of three pages (WIP)
- Report Inventory & Usage Stats
- Schedule Refresh and Subscription Overview
- General Config Information
1. Report Inventory & Usage Stats
The first page is the most comprehensive one, with the highest information density, providing a report inventory and display for usage statistics at the same time. You could definitely consider separating the usage statistic from the report inventory.
Depending on the objective of analysis you have the option to switch the table with a bookmark navigation button to focus on users or reports.
This report page is also great to investigate the report which have rarely never or not lately been used. To define which unused reports you want to display I recommend to use the bottom right slicer. In case you have reports, which have never been open with an “interactive request” once, there is a separate slicer for this as well.
One main asset of the pbix is the following sql script for the purpose of building a catalog table. The sql script combines information from various tables into one catalog dimension for all of your items in your report and has the very most properties of each item.

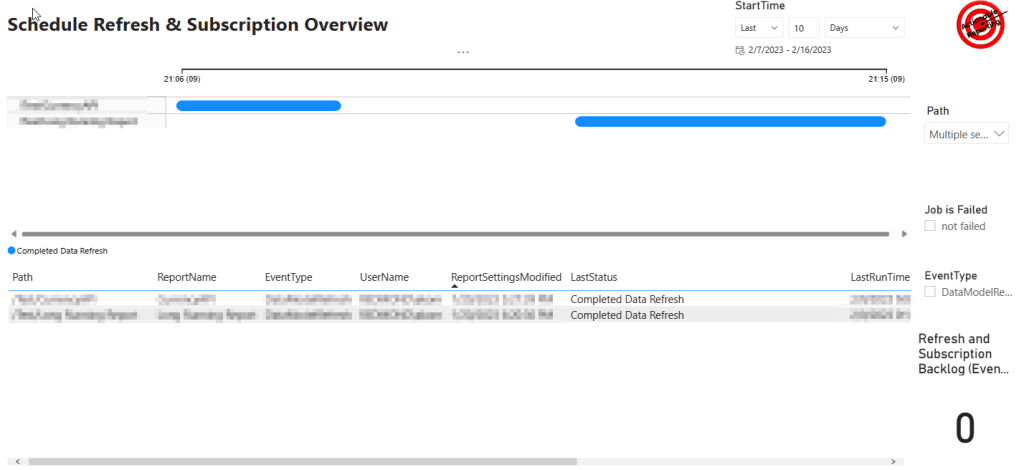
2. Schedule Refresh and Subscription Overview
The second page is for subscription and schedule refresh already discussed in a previous article: Power BI Report Server Monitoring for Subscriptions and Schedule Refreshes. New here is on the bottom right corner the number of lines in the event table. The bigger the number the more likely you will be having an issue with a big backlog. Depending on the nodes you have this might take shorter or longer to catch up. In case you have not multiple nodes through scale-out deployment available, the server will be able to start 6 events (schedule refreshes or subscriptions) per minute.
3. General Config Information
The third page is nothing special, just some report server configurations, which you can easily see and adjust in the advanced properties of the report server.

More Info about the PBIX and how to get started.
All queries in the report use direct query mode, so there’s no need to refresh, and your monitoring is always up to date. To make the report work for you, replace the database parameter “ReportServer” with your database name. The report should be opened on your report server machine, since it is using server localhost. The report was created with Power BI Desktop for Report Server on Sep 22, so you should be able to use and publish it to your report server. Instead of a sql view in the database I chose to add the date dimension under utilizing the the system table “master..spt_values” starting from 2020 till the current date.
References and sources for report
- I want to give a shout out to Nikola Ilic for providing input for this pbix file through his blog post: Check Power BI usage metrics on Report Server! – Data Mozart (data-mozart.com)
- The pbix includes the job overview also already published in one of my previous blog posts. Essentially it incorporates the report into this report, but focuses just on report server: Power BI Report Server Monitoring for Subscriptions and Schedule Refreshes
- Info for the catalog dimension in regards to the report server’s internal analysis services instance and its related information was taken from Pedro Salinas-Ruiz blog Power BI Report Server Query to List Power BI Reports – Business wIntelligence
- There are various documentations how to get an overview of subscription and schedule refreshes such as the following community discussions: info1, info2 , but Filipe Caetano made me aware of a script which is used for one of the two overview tables in the subscription/schedule refresh page
Taking the report further
I am sure the report still has a lot of potential. It could be enhanced further if the decision would be made to divert from direct query connection to import connection mode. This would enable to integrate data from various other sources, such as report server log files, the rsreportserver.config, powershell or WEB API calls.
Furthermore there is quite some potential to optimize the sql queries even further. For example one could merge the subscription/schedule refresh dimension with the catalog dimension.
For sure visualization and report design wise the report is definitely not where I would like to have it. for example this monitoring report is definitely not IBCS compliant, but I would be happy to see someone taking it in this direction further.
Ask for a Power BI Report Server Assessment
In case you want to know more about this topic, I highly recommend that you reach out to a Microsoft representative in your region, such as your Customer Success Account Manager, for assistance and ask for a Power BI Report Server Assessment or for a Power BI Service Assessment potentially available to you.
Please send me Feedback
If you found the pbix helpful or if you have any feedback I would be happy to hear about it. Feel free to ping me via the channel that suits youi.
Also if you are able to develop the pbix further, I would be super happy if you send me your version back.
