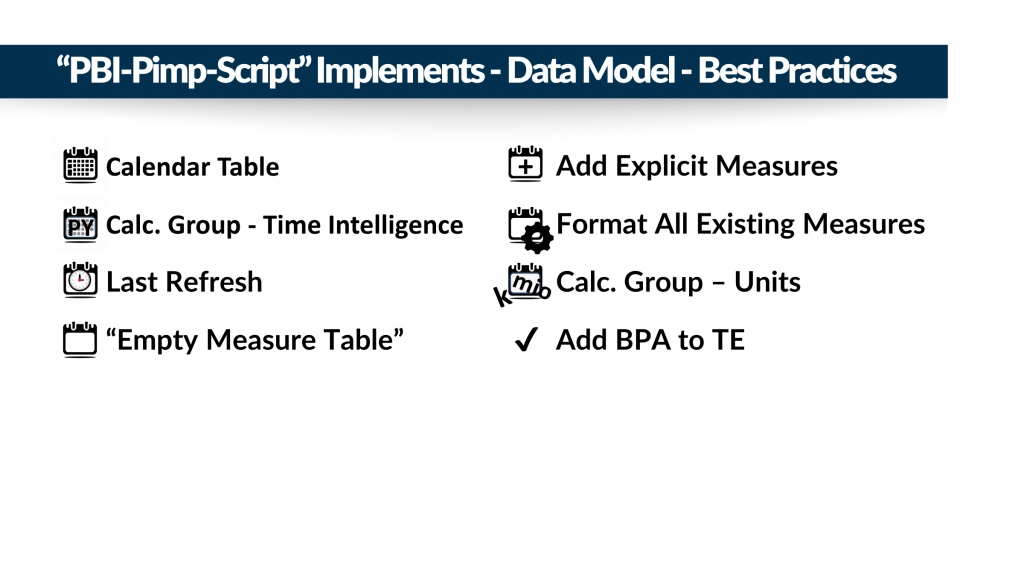
Do you would like to apply data model best practices with a click of a button to your existing Power BI reports? Than the “PBI-Pimp-Script” is the right place for you!
Edit: This script had a major revamp, published on 31. January 2024 and includes now a lot more: Explicit Measure Creation, Units calc group, Further Calendar Tables, Adding BPA and more.

This script is designed to streamline and enhance your Power BI modeling experience. Whether you are a Power BI data model expert or just getting started, this script helps you supercharge your modeling efforts.
Overview and Customization
At the beginning the PBI-Pimp-Script offers through various prompts a range of enhancements that can be customized to fit your specific needs. Let’s dig into key aspects of this script and how you can tailor it to your requirements.
Calculation Group for Time Intelligence Measures
One of the essential features of this script is the ability to add a Calculation Group for “Time Intelligence”. Calculation Groups is a great way to organize or even reduce your measures, making it easier to navigate and manage your Power BI model. With this script, you can define a custom name for your Calculation Group, define the name of the date table and date column to be used. This makes sure your Time Intelligence Calculation Group works even if you are using non-standard names. Do you have a fiscal year and need fiscal year calculation items than the script offers the flexibility to adjust the cutoff day. In contrast you don’t need YTD, than decide against it.
Date Dimension Table
A robust Date Dimension Table is crucial for time-based analyses in Power BI. The PBI-Pimp-Script allows you to generate a Date Dimension Table and specify its name and the date column name to match your dataset’s structure. This script follows the approach to push the date dimension as far as possible into the backend. For the script this means this is not a calculated table and instead a power query date dimension. You need to make sure the current time selection 2018 till 2025 fits your needs.
Empty Measure Table
The script includes an option to generate an Empty Measure Table. Not sure this is the correct name, but that’s how I call this table. The table basically consists of nothing but two columns which are optional to be filled in. Both columns are by default hidden, that means you won’t immediately find this table. The purpose of this table is to work as container for all of your measures. In case the description of the measures is not sufficient, potentially you could also use this table to document your measures in the columns with editing the table directly in Tabular Editor. In case you need additional measure containers, make sure to rerun the script and stating Yes just for the empty measure table question. If you follow tabular modeling best practices than all of your fact tables contain zero visible columns. Therefore Empty Measure Tables is the way to go.
Last Refresh Table
Monitoring data refresh times is essential for data-driven decision-making. The script offers the option to create a Last Refresh Table, which keeps track of the last time your data was refreshed. This information can be invaluable for troubleshooting and ensuring that your data is up-to-date. You can use than this table to add a visualization to your report displaying also the last refresh time to your end-user.
DAX Formatting
Consistency is key when it comes to DAX (Data Analysis Expressions) formatting. The script allows you to format all calculation items and if you want also all measures in your model, ensuring that your DAX expressions are easy to read and maintain. This feature enhances collaboration and ensures that your entire team follows the same formatting conventions.
And much more
Now that you’re familiar with the powerful features of the PBI-Pimp-Script, let’s walk through the manual process of applying it to your Power BI model.
Manual to Apply the Script
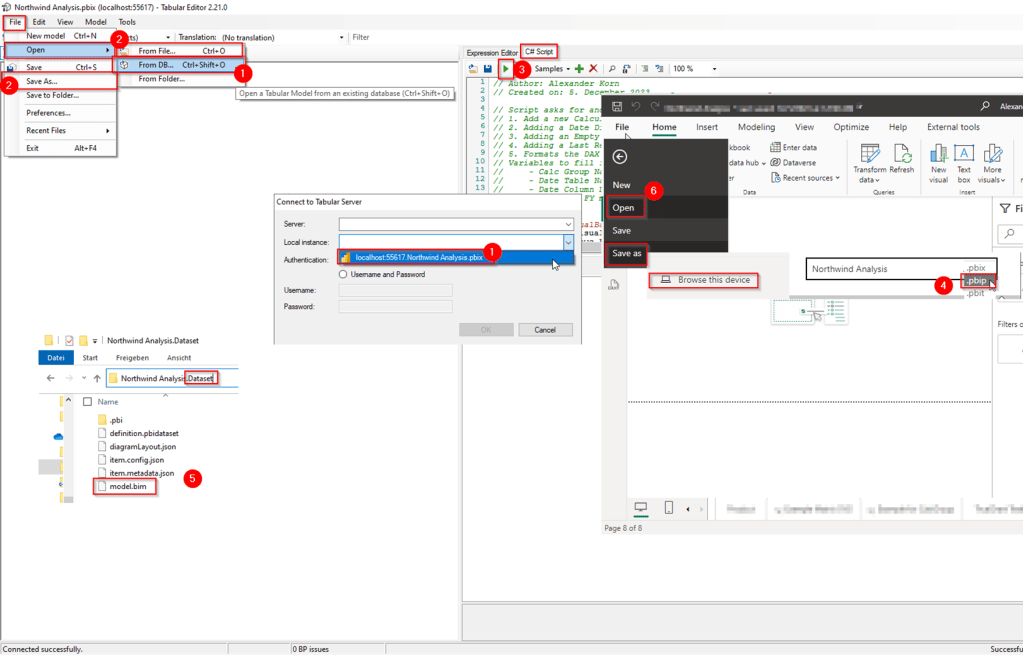
- Connect Tabular Editor (TE2) to PBI Report: Start by connecting with Tabular Editor (TE2) to your local Power BI instance, your Power BI report opened in PBI Desktop
- Save and Reopen .bim Locally with TE2: To ensure that you have the necessary access to the Power BI model, save and reopen the .bim file locally with TE2.
- Apply “Pimp-Script”: Copy+paste the “Pimp-Script” to enhance your Power BI model. Save it as Macro for reuse. The script will prompt you with various options for customization.
- Save PBIP: Save your Power BI project (PBIP) to preserve your changes.
- Ingest Model.bim into the PBIP File: Copy and replace the updated “Model.bim” into the respective “ReportName.dataset” folder of your Power BI project.
- Reopen PBIP File: Reopen your Power BI project file to see the improvements and enhanced modeling capabilities in action. You might need to apply minor fixes, like the relationship between fact tables and new date dimension.

I sincerely hope the PBI-Pimp-Script, will help you to apply Power BI data modeling best practices even easier with just a few clicks.
You need more Power BI data modeling best practices or have ideas to take the script further? –> Ping me via LinkedIn

One thought on “Power BI – Pimp – Script”