You want to jump right into, what the report looks like than go here: https://app.powerbi.com/view?r=eyJrIjoiMDNiOTMyZDgtNjA3ZS00ODJhLTgyYmQtMWUyMTVjM2Y4OTJlIiwidCI6IjllYTUzNDRiLWFiMzAtNGNjYi1hOWFjLThlODU4NWU1ZWZhZSIsImMiOjl9
In the digital age, the ability to analyze your professional network and present your career accomplishments can significantly impact your success. Two distinct yet interconnected areas where Alexander Korn has excelled are the analytics of LinkedIn engagement and the automation of a curriculum vitae (CV) through LinkedIn data.
Part I: Analytics of LinkedIn Engagement
The meticulous LinkedIn statistics report designed by me is more than just a collection of metrics; it’s a blueprint for engagement, growth, and content strategy, inspired by the innovative spirit of the data analytics community.
A Community-Driven Approach
The conception of this report was sparked by Jens Becker’s nice presentation at the “German Power BI Expert Circle,” aka “Dashboard feedback” 😉 The presentation of the report and following discussion was the groundwork for my current template. They guided me towards the right resources, proving that the best achievements are often collaborative efforts. 🙂
One of those resources was a report by Gustav Dudek. Definitely need to give him special recognition since his dashboard served as an absolut main source of inspiration. You will notice that my report for the statistics part is quite similar to his.
The Template for Success
Through the shared .pbit file, I am extending an invitation to all professionals to partake in the further development of this report. This tool allows users to map out their LinkedIn data, offering visibility into which content drives engagement and how it influences their network’s growth.

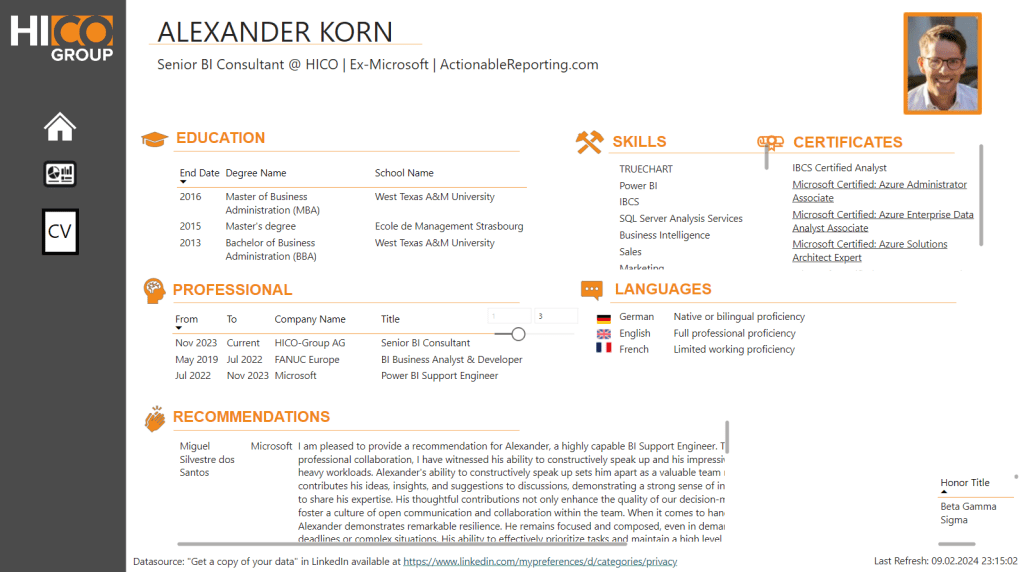
Part II: Automated CV Based on LinkedIn Data
In an era where personal branding is paramount, having an automated, data-driven CV can distinguish you in the marketplace. My report goes beyond analytics to include a second page that “automates” the creation of a CV directly from LinkedIn data somewhat.
By synthesizing LinkedIn data into a dynamic CV, I showcas a novel way of presenting professional stories, where accomplishments and career progress are not just told but shown through the lens of data.
Manual
“Just Plug and Play” it is a 3 step process:
1️⃣ Download All files from 2 places LinkedIn:
You might need to be creator to see the stats for the posts.
! Make sure to change the language before to English, in order to have the exact same column names.
https://www.linkedin.com/mypreferences/d/categories/privacy And “Get a copy of your data”.
https://www.linkedin.com/analytics/creator/content/?timeRange=past_2_years
This is actually a modification of the URL in order to get not just the last year which is accesiable via the UI. Followers before the two years will not be visible per day, instead PowerQuery just adds all of those right before the first day, we get data.
2️⃣ Create a simple an Excel file manually to give your posts a name and classify them. I have used the following columns. To make it simple for you, I would use the same names. URL,ID,Category,Title,File,Blog Article,Highlight.
The URLs I got from the export. So make sure to get those first to capture all posts.
In case you don’t have this manual file no problem. You can still use the “backup page” of the report.
3️⃣ Download+Open my Power BI template and add the correct 3 parameters. The file expects two paths for Excel files and one folder path, where all of your csvs are stored. For the folder include “\” at the end. For example: C:\User\USERNAME\documents\LinkedInSourceFolder\
Conclusion
My dual-faceted Power BI report serves a dual purpose: it acts as a magnifying glass over the intricacies of LinkedIn engagement while simultaneously reinventing the traditional CV. Hopefully no more need to update LinkedIn and at the same time my own personal CV.
You want to have the template? Here it is: https://github.com/KornAlexander/PBI-Tools/blob/main/Ultimate%20LinkedIn%20Report.pbit
