When it comes to streamlining your Power BI data modeling, the value of automation cannot be overstated. One of the most powerful tools available to achieve this automation is Tabular Editor, where you can write C# scripts to optimize and automate repetitive tasks. In this blog post, I’ll introduce you to my Power BI Toolbox — an extension of my original Pimp script — and share how it helps bring efficiency and best practices to Power BI data modeling.

Tabular Editor Scripts: The Key to Automation
Tabular Editor Scripts, also referred to as macros, C# scripts, or custom actions, are essential tools for automating actions within Tabular Editor. Tabular Editor, an invaluable tool for Power BI professionals, offers the ability to write custom scripts to save time and ensure consistency in data models. With C# scripting capabilities, you can automate a huge collection of tasks like creating measures, setting properties, and sooo much more.
Over the years, I’ve developed and wide range of these scripts. My Power BI Toolbox is after my PIMP script the next evolution in this journey, containing a suite of over 80 Tabular Editor scripts, each designed to simplify various aspects of Power BI data modeling. If you want to know more about why this stuff is important for Tabular models check out the following video with Reid Havens. https://www.youtube.com/watch?v=-9YaxArn3TM
What’s in the Toolbox?
My Power BI Toolbox is a collection that includes:
- Many of the Official Tabular Editor repository macros (excluding those exclusive to TE3)
- Bernat’s macros, You will definitely find hidden gems there.
- My own macros, which build upon the lessons learned from my earlier PIMP script
More Details on My Favorite Macros
Here are some of my favorite macros that I’ve developed to improve efficiency and automation in Power BI data modeling:
- Calendar Table as Calculation Group: This macro helps you create a calendar table as a calculation group and mark it as the calendar table in your data model. It’s a quick way to ensure that your time intelligence functions are referencing the correct table.
- Time Intelligence Calculation Group: This script automatically detects the calendar table and creates a calculation group for common time intelligence measures like Year-to-Date, Quarter-to-Date, Month-to-Date, Previous Year, and more. This reduces manual work and helps ensure consistency in your model.If you have not marked your calendar table as calendar table it will ask you for it.
- Units Calculation Group: Creates a calculation group for units without splitting text or ratio measures, making it easier to maintain a clean, efficient model structure.
- Empty Measure Table Creation: This macro allows you to create an empty measure table, which is useful for organizing measures and maintaining a clean data model structure. The script needs to be run in two steps, first creation, than save, than hiding the column.
- Explicit Measure Creation for Selected Columns: This macro lets you create explicit measures for selected columns and move them into a designated display folder. Additionally, it prompts you with the option to move these measures into a different table, such as an empty measure table, ensuring your data model is organized.
- Previous Year, Delta PY, and Delta PY % Measure Creation: Automatically generates explicit measures for all selected measures with the variation previous year, delta previous year, and delta previous year percentage. The script is smart enough to recognize the marked calendar table and link these measures appropriately, saving you a lot of repetitive work.
- Macros Containing Metadata Documentation This macro inspired by Martyn Booth is design to automatically document the model. The macro adds four new calculated tables need to be added, saved, and then hidden as part of the standard workflow. These tables can then be used to effectively document the data model, providing valuable metadata insights. The four calculated tables are: info.view.Tables, info.view.Columns, info.view.Measures, and info.view.Relationships. This approach essentially replaces the need for additional tools like VertiPaq Analyzer or Bravo for Power BI, to a considerable extent. One limitation is the absence of column size information, which would be a useful enhancement, but the benefit of automatic updates makes this a powerful feature for keeping documentation current without extra manual work. More info here: https://www.notjustaprettydashboard.com/auto-documentation-report-using-info-view-dax-functions/
- Combine Time Intelligence with Value Parameter: This macro, inspired by Mark Endicott, extends my time intelligence template by adding a dynamic value parameter. The number of years is now made dynamic, allowing for more flexibility in time-based analysis. The next step is to make the period selection fully dynamic, enabling switching between different time frames such as year, quarter, month, and day.
These scripts are targeted at best practices in Power BI data modeling, enabling you to standardize and streamline your workflows in a consistent, efficient manner.

No Admin Rights? No Problem
No admin rights? No problem. Just make sure you’re running the latest version of Tabular Editor Portable. This version allows you to use all the powerful features of Tabular Editor without needing to install anything, making it perfect for environments where you lack administrative privileges.
How to Install the Power BI Toolbox for Tabular Editor
Installing the Power BI Toolbox is straightforward. You can use the Installation Script available here: Installation Script. Or as an alternative you can also just copy paste the MacroActions.json file into your AppData\Local\TabularEditor directories. Just paste into your file explorere “%AppData%” and you are already almost there.
Here is a video of how to install it, if manual is not what you prefer: https://www.linkedin.com/posts/alexanderkorn_hicocando-actionablereporting-tabulareditor-activity-7250519843966181377-sfdd?utm_source=share&utm_medium=member_desktop
The installation script takes care of the following steps:
- Backup the MacroActions.json file if it exists in your
AppData\Local\TabularEditororTabularEditor3directories. - Add a fresh MacroActions.json file from my GitHub repository if one does not already exist.
- Append my DataModelToolbox.txt file to the current MacroActions.json file if one exists. Please note, if you already have some of my macros, this script does duplicate all of them.
The MacroActions.json file is where all the magic happens, containing the macros that Tabular Editor will use to automate your Power BI tasks. You can check it out here: MacroActions.json File.

How to Execute C# Scripts in Tabular Editor 2
To execute C# scripts in Tabular Editor 2, follow these simple steps:
- Connect to Open Power BI Desktop: Start by connecting Tabular Editor to your open Power BI Desktop instance to gain access to the data model.
- Right-Click Options: You can execute scripts by right-clicking on a table, column, data model, or measure within the model. Depending on the certain Macro it will be visible within the context menu where you can select and run the script.
- Navigate to the C# Section: Alternatively, you can directly navigate to the C# scripting section within Tabular Editor, where you can write and execute your scripts.
Shortcuts for Macros
In Tabular Editor 3, you can even assign shortcuts to these actions, giving you more flexibility and making repetitive tasks even faster. This is especially useful when working with large and complex data models where efficiency matters most.
Here is a video of this in action: https://www.linkedin.com/posts/alexanderkorn_do-you-also-have-a-button-to-implement-power-activity-7252416004079677443-0HHC?utm_source=share&utm_medium=member_desktop
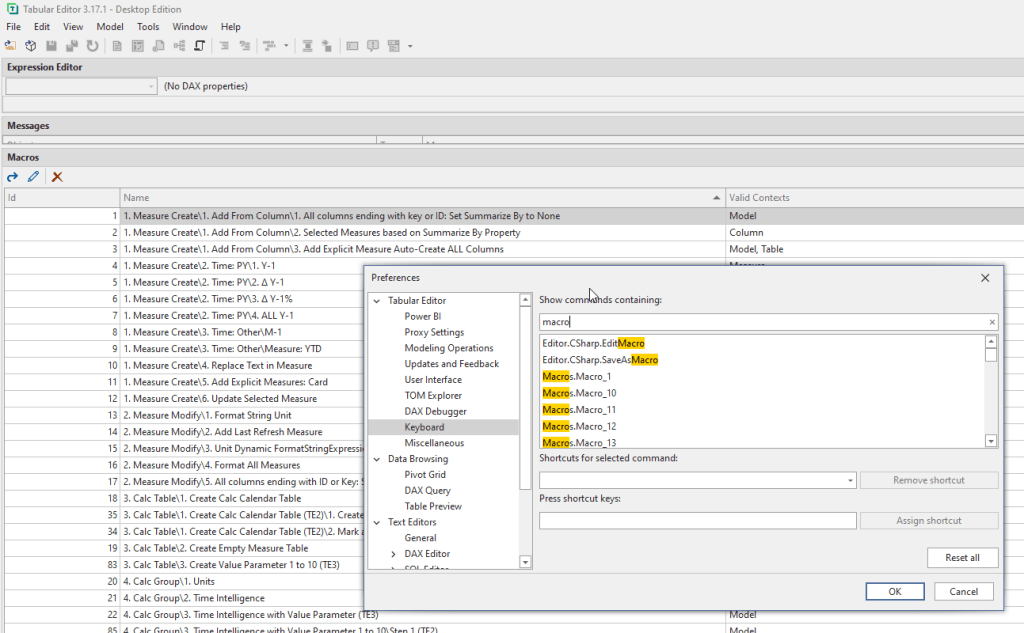
You can either set the shortcuts for the macros under Tools > Preferences > Keyboard or alternatively copy and paste my UiPreferences.json file into your directory AppData\Local\TabularEditor3. You can find the UiPreferences.json file here: UiPreferences.json.
I am using the following shortcuts for my macros:
| Macro ID Range | Shortcut Combination |
|---|---|
| 1 to 9 | CTRL + SHIFT + Number (1 to 9) |
| 10 to 19 | CTRL + ALT + Number (1 to 9) |
| 20 to 29 | CTRL + ALT + SHIFT + Number (1 to 9) |
I need to give for the keyboard shortcut and Stream Deck idea full credit to Bernat Agullo Rosello. He gave me the whole idea. I wasn’t aware of Stream Deck till he pointed me that way. While he had the idea, I went ahead and made it real. I am now using a Stream Deck with custom icons for these shortcuts, which allows me to apply data model changes with just the press of a button. This setup significantly enhances my productivity by making these powerful macros available at my fingertips. With the Stream Deck, I can visually organize the most frequently used macros, assign dedicated buttons to each, and execute them instantly. This workflow improvement not only saves time but also makes navigating complex models more intuitive, as I can easily trigger common actions without needing to remember numerous key combinations or navigate through menus.

Sorting the IDs
All Macros have an ID, those can be consequential but don’t need to be. The sorting in Tabular Editor 3 is by default exactly like the MacroActions.json file is sorted. That being said, if you move macros around in the json file, than the IDs do not get automatically adjusted. At the time of writing you will see that actually my file skips a few IDs and is not perfectly sorted. Andreas Nordgaard provided for us a free Python script which does the job.
Save the python script in the same location as the Macro file install python, potentially modify the python script to use the correct parent path and you are good to go.
Just be careful if you change your IDs those will than potentially not match your Tabular Editor 3 shortcuts anymore.
Stream Deck Profile
In case you also have Stream Deck and want to overcome the hustle to set it up here is my Stream Deck profile, which should have all the icons. Just make sure your shortcuts in TE3 align with the profile. https://github.com/KornAlexander/PBI-Tools/blob/main/Data%20Model%20Toolbox/Tabular%20Editor.streamDeckProfile
Why Automate?
The Power BI Toolbox is more than just a collection of scripts; it’s about bringing best practices to every model you create. It’s about removing friction, increasing productivity, and reducing the chance of human error when performing repetitive tasks. Automation lets you focus on what matters most: making data-driven decisions that impact your business.
Get Started Today
Ready to give your Power BI data modeling a productivity boost? Install the Power BI Toolbox and start automating today! You can access the installation script here and transform how you model your data or alternativly just add it manually.
Let me know if you have any questions or if you need help getting started. Maybe do you have a killer script I need to add. Let me know. Would be very happy to receive it. Happy modeling! 🙂
