
Preamble: This article is not meant to be a fully comprehensive guidance why adopting Microsoft Fabric makes sense for every organization. Instead, it highlights a collection of practical examples showing the benefits Fabric can deliver — even if your primary interest is Power BI. The views expressed here are my own and do not represent official Microsoft guidance.
Power BI is well established in many organizations. Reports run reliably, dashboards are widely used, and insights drive daily decision‑making. But as these environments grow, familiar pain points continue to appear beneath the surface:
- Deployments become more fragile as complexity increases.
- Troubleshooting takes longer and often depends on deep expert knowledge.
- Semantic models, although functional, become harder to maintain and optimize.
These challenges may sometimes be present from the start, but they often become noticeable only as Power BI evolves into a business-critical tool.
This is where Microsoft Fabric steps in. You professionalize your environment.
Even for Power BI only environments not focused on other workloads like data engineering, data science, or real-time analytics, Microsoft Fabric brings crucial value. It streamlines management, enhances reliability, and simplifies troubleshooting—addressing issues that often surface as complexity grows. This article highlights why Fabric strengthens Power BI itself, regardless of your interest in other workloads.
1. Model Diagnostics with Fabric: BPA & Memory Analyzer in Just “Two Clicks”
Before Fabric, deep model analysis required juggling multiple tools such as Tabular Editor, DAX Studio, XMLA endpoints…
While powerful, the process was manual and dependent on expert users.
Fabric radically simplifies this workflow by integrating these powerful diagnostics directly into the platform. With only a few clicks, teams can run the Best Practice Analyzer (BPA) and Memory Analyzer without leaving the environment.
This integrated, frictionless workflow enables teams to:
- Quickly assess rule violations and semantic model details such as model size per table/column
- Identify performance bottlenecks
- Apply best practices as part of a repeatable, team‑wide process
Fabric doesn’t change what needs to be analyzed or how to fix it — it changes how accessible and reliable that analysis becomes. And don‘t get me wrong: I‘m a huge fan of these tools and they are still very valid choices.
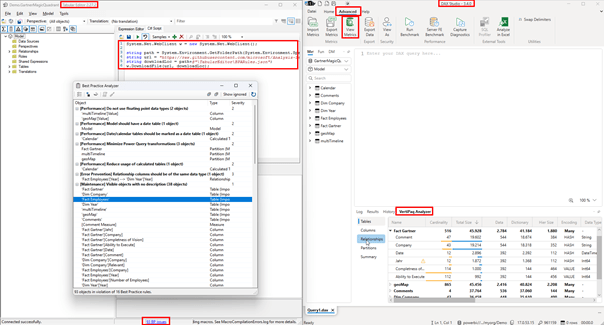
External Tools: The complex – expert way: Install Tabular Editor & DAX Studio + XMLA Endpoint
With the traditional approach you need to use DAX Studio and Tabular Editor. As shown in the screenshot below you need to add the BPA with a script into Tabular Editor. Btw. the installation script is part of my toolbox. My Power BI Toolbox: 80+ Tabular Editor Macros to Automate Data Model Development – Blog about Actionable Reporting – Alexander Korn Toolbox Installation Script: PBI-Tools/Data Model Toolbox/Installer HICODataModelToolbox.csx at main · KornAlexander/PBI-Tools · GitHub
Or alternatively just install the BPA directly with this script.
Analysis-Services/BestPracticeRules at master · microsoft/Analysis-Services · GitHub
Afterwards you can connect to your model (XLMA endpoint or local PBI Desktop instance) and run the BPA.
With the memory analyzer (vertipaq analyzer) the process is slightly less complicated but also requires a third party tool like DAX studio.
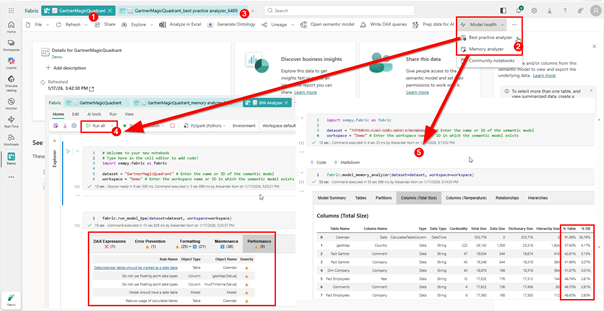
In Fabric: VertiPaq Analyzer & BPA the easy way – with “two clicks”
With Fabric this process is now super simple and no need for third party tool.
- Open semantic model
- Click on BPA / Memory Analyzer
- Run All Notebook
That’s it – now the same process follows like you would do in the external tools. For example checking for columns and data types with high impact or assess and fix the BPA violations.
2. Monitoring and Troubleshooting: Full Visibility Instead of Guesswork
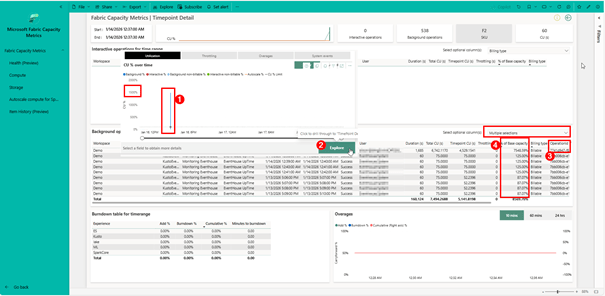
In many Power BI environments, teams struggle not because things fail, but because things become slow, unpredictable, or resource‑intensive without a clear explanation. In the capacity metrics app (installation guidance here: Install the Microsoft Fabric capacity metrics app – Microsoft Fabric | Microsoft Learn) Performance bottlenecks often appear as capacity spikes, unexplained slowdowns, or inconsistent report behavior — and without proper insight, diagnosing these issues requires stitching together logs from multiple sources.
Fabric dramatically improves observability across the entire analytical environment by providing:
- Detailed, structured logs that reveal exactly what happened and when
- User‑friendly monitoring dashboards that visualize performance patterns
- Clear classification of issues by gateway, dataset, service, or model
- Faster diagnosis due to consolidated, contextualized monitoring data
Instead of reacting to unclear symptoms, teams can now proactively understand how workloads behave and where performance pressure originates.
Stuck with Operation IDs? Fabric Monitoring Unlocks Them
Anyone who has investigated a capacity spike or sudden performance drop has encountered cryptic Operation IDs or Root Activity IDs. Historically, these identifiers were extremely difficult to interpret — they didn’t map to a specific query, user action, or event.
Fabric Monitoring fundamentally changes this. Once enabled, it allows teams to:
- Trace an Operation ID back to the exact DAX query executed
- See the actual message or condition associated with the operation
- Understand the filter context, duration, and triggering report
- Inspect historical performance patterns to identify recurring bottlenecks
This transforms diagnostics from guesswork into precision.
What used to look like “Operation xyz123 consumed high resources” can now be understood as:
“This specific DAX query with this filter context consumed excessive memory and caused a capacity spike.”
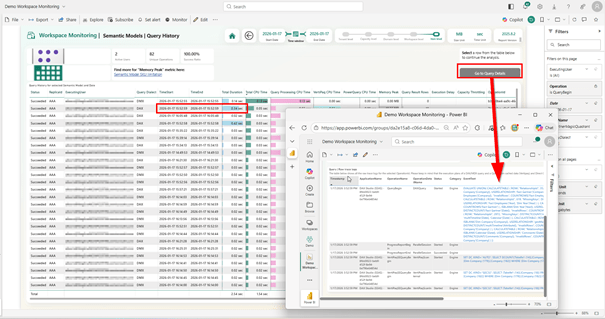
Workspace Monitoring: The Missing Link for Real Diagnostics
Workspace Monitoring provides the level of visibility Power BI admins have been missing for years — the kind of transparency that turns isolated signals into actionable intelligence. Instead of relying on high‑level capacity charts or disconnected logs, Workspace Monitoring brings together all query activity, performance characteristics, and error context in a single, cohesive diagnostic layer.
At its core, the built‑in template report offers:
- Query history with timing, duration, and type, allowing admins to see precisely when workloads peak
- Full drill‑through into query details, exposing expensive DAX statements, filter context, and execution patterns
- Performance trends over time, helping teams identify recurring bottlenecks rather than treating symptoms in isolation
- Error details surfaced directly in context, eliminating the guesswork that typically accompanies operational troubleshooting
But the real value emerges when you begin using these views together. With Workspace Monitoring, it becomes possible to correlate user behavior, query characteristics, report performance, and capacity load — all without leaving the Fabric environment.
This unified lens transforms Workspace Monitoring into a genuine forensic toolkit. Instead of trying to decode red bars in a metric app or pulling logs from multiple systems, admins can reconstruct what happened, why it happened, and who or what triggered it.
For example:
- A sudden spike in capacity can be tied directly to the DAX query that caused it.
- Slow report interactions can be traced back to specific visuals or filters.
- Intermittent issues can be investigated by reviewing long‑term patterns rather than relying on anecdotal observations.
When combined with Fabric User Activity Monitoring (FUAM), this visibility becomes even more powerful. FUAM shows how users are interacting with reports — which pages they open, how frequently they query the model, and where user-driven pressure might be occurring.
Together, Workspace Monitoring and FUAM give organizations a complete operational picture that spans both system behavior and user behavior. This combination is essential for performance tuning, governance, right‑sizing capacity, and making evidence‑based platform decisions.
Instead of reactive troubleshooting, teams gain a proactive, data‑driven approach to managing their analytical environment — finally closing the long‑standing visibility gap that has challenged Power BI admins for years.
3. Access to Power BI Premium features without Premium cost — and why starting small with Fabric works
One of the most overlooked advantages of introducing Microsoft Fabric into an existing Power BI setup is the ability to unlock many Power BI Premium capabilities without purchasing a dedicated Premium capacity or Premium Per User licenses. With Fabric SKUs starting as low as F2, organizations can access features that previously required a full P1 (F64) or PPU. This fundamentally changes the adoption discussion for smaller teams that want to professionalize their Power BI lifecycle without enterprise‑level spend.
Key Premium‑class capabilities enabled by Fabric include:
• Deployment Pipelines for proper Dev/Test/Prod lifecycle management
• Advanced dataset and workspace governance
• Operational and scalability controls traditionally tied to Premium
• Copilot for Power BI — now available starting from F2 (previously required F64)
This directly challenges the long‑held assumption that Premium is only realistic for large enterprises with large capacities. That used to be true, but Fabric has significantly lowered the entry point. In many cases, an F‑series capacity can even be cheaper per user than adding PPU licenses once you have more than a small group of users. As a result, Fabric becomes a cost‑effective way to unlock Premium functionality while also opening the door to broader data‑platform capabilities.
At the same time, Fabric scales down extremely well. Even small SKUs like F2, F4, or F8 already deliver:
• Centralized monitoring
• Pipeline‑based deployments
• Workspace isolation
• Robust governance controls
• Model‑ and capacity‑level diagnostics
• Integration with Lakehouse, Data Engineering, and other Fabric experiences
This makes it easy to follow a pragmatic, low‑risk adoption strategy:
- Start with a high‑value, well‑contained use case — something small, measurable, and easy to control.
- Measure improvements—model performance, stability, observability, developer workflow, governance.
- Scale intentionally—expand workspaces or capacities only when evidence shows clear value.
This approach avoids over‑investment, accelerates time‑to‑value, and establishes a strong, future‑proof architecture—while benefiting from Premium‑level features at a fraction of the historical cost.
Conclusion
Fabric does not replace Power BI — it elevates and operationalizes it.
- Developers gain cleaner diagnostics, deeper insight into model behavior, and repeatable pipelines.
- Admins gain stable operations, proactive monitoring, and the tooling to troubleshoot efficiently.
- Organizations gain governance, reliability, and a scalable analytics foundation for the future.
Fabric is not dogma — it is a strategic evolution that emerges naturally as Power BI environments mature and grow in complexity.
