
Jumpstart your Fabric environment with a real demo on real data — in a single line.
import fabric_jumpstart as jumpstart
jumpstart.install("hochschul-insights")
About three minutes later you have a complete German higher-education analytics stack in your workspace — a Lakehouse, a Direct Lake semantic model, an 8-page IBCS report with an Azure Map of all 422 Hochschulen, a pipeline and a Data Agent — all built on real public DESTATIS GENESIS data. No toy sample data, no manual wiring.
This is the first in a new Fabric Demo Series — small, opinionated, end-to-end demos that you can install into your own Microsoft Fabric workspace in a single click and play with right away. More demos coming soon (Defense, Retail, Health, Automotive — all GENESIS-powered).
What is Hochschul-Insights?
A complete German higher-education analytics demo, built on real public DESTATIS GENESIS data, enriched with Wikidata (city + geo) and wrapped in an IBCS-styled Direct Lake report. Eight pages, an Azure Map, a Data Agent for natural-language Q&A, and a single notebook to deploy the whole thing.

What you get in your workspace
- Lakehouse
hochschul_insights_lh(schemas enabled, schemaGenesis) with 16 Delta tables (10 facts, 6 dimensions). - Notebooks — an
00_start_hereentry point, a snapshot loader, the GENESIS Loader (DESTATIS REST API) and a Wikidata-enriched Dimensions notebook. - Data Pipeline
hochschul_insights_pipelineorchestrating parallel loads. - Direct Lake Semantic Model
HochschulInsightswith calculated calendar + IBCS measures. - Report
HochschulInsights— 8 pages, IBCS layout, Azure Map of all 422 Hochschulen. - Data Agent
hochschul_stats_agentfor natural-language Q&A on the model.
Two install modes
The installer supports two flavours, and you pick by whether you paste a token or leave it empty:
- Snapshot mode (default, no token) — loads bundled CSV snapshots from the public GitHub repo. Fastest path to “look at the report”, no signup needed. Finishes in a few minutes.
- Live mode (free DESTATIS token) — runs the real pipeline: pulls fresh data from DESTATIS GENESIS, enriches with Wikidata, lands Delta, refreshes the model. ~10–15 minutes end-to-end. Schedule weekly afterwards.
How to install
Hochschul-Insights is now an official community Fabric Jumpstart, so the recommended path is a single line of Python.
Recommended — one line via Fabric Jumpstart
In any Fabric notebook:
%pip install -q fabric-jumpstart

import fabric_jumpstart as jumpstart
jumpstart.install("hochschul-insights")
About 3 minutes later (snapshot mode) the whole stack lands in a single hochschul-insights workspace folder. Then:
- Open the
hochschul-insightsfolder and the00_start_herenotebook. - (Optional, live mode only) register at www-genesis.destatis.de, copy your free username token and paste it into the parameters cell. Leave it empty for snapshot mode.
- Hit Run all, then open the
HochschulInsightsreport.
No az login, no pip install, no environment variables — the Jumpstart authenticates via notebookutils, auto-detects your workspace and deploys everything. To clean up, just delete the hochschul-insights folder; every item lives inside it.
In live mode you can watch the pipeline run from the same notebook — three parallel GENESIS loads, then the dimensions builder, then the semantic model refresh:

A peek at the report
Eight pages, all IBCS-styled. Here is the live report — click around, it is the real thing (Publish to web, all public DESTATIS data):
Three pages are worth pointing out as you click through the embed above:
- Home — the landing page: KPIs and a Top-10 university ranking. The hero block here is drawn by a self-made HTML viewer visual (more on that below).
- Übersicht — totals across all 16 Bundesländer plus an Azure Map of all 422 institutions (lat/lon from Wikidata, City fallback).
- Studenten — student counts broken down by Fächergruppe, Bundesland, Hochschulart and gender, with cross-filter scenarios baked in.
A self-made IBCS custom visual — built in a few prompts
The multi-tier bar chart on the Studenten page isn’t off-the-shelf — I built that custom visual myself, and that is almost the best part of the story: it went from “I wish Power BI had this” to working-on-the-page in well under an hour, with just a handful of prompts to an AI coding assistant.
It’s a purpose-built IBCS custom visual: AC bars with PY/PL reference markers and Δ / Δ% variance tiers, semantic green/red, all following the IBCS notation standard. It ships in two orientations — horizontal (bar) and vertical (column) — exactly the integrated variance chart the IBCS world loves and stock Power BI doesn’t include. One caveat: at the time of writing it isn’t scrollable yet, so very long category lists get clipped — that’s on the roadmap.
The takeaway: rolling your own Power BI custom visual used to be a side project. With an AI coding assistant it’s an afternoon — often less.
HTML viewer on the Home page
The hero block on the Home page is rendered by an HTML content viewer custom visual: it takes a measure that returns HTML/CSS and renders it live inside the report. That’s how the landing page gets its own typography, KPI tiles and layout without ever leaving Power BI. This one I didn’t build myself — it’s an existing custom visual — but it pairs perfectly with the self-made IBCS chart.
Behind the scenes — what makes this fun
- Direct Lake on schemas-enabled lakehouse — no import, no scheduled refresh of the model.
- Wikidata SPARQL for Hochschule geolocation (EF1 + lat/lon, City fallback for the half-dozen missing ones).
- IBCS measures — units calc group, semantic colours, scenario shading.
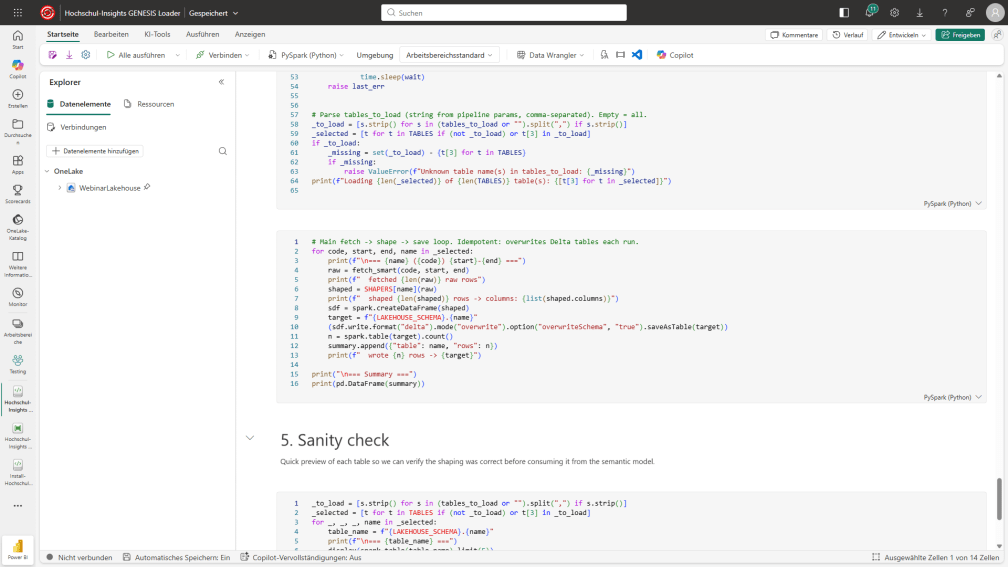
- Loader notebook is pure PySpark +
requests+pandas— no add-ons, runs on the default Fabric runtime:
Take it further — build your own
Don’t stop at this demo. Open GENESIS-Online, pick any of the thousands of other tables, swap them into the loader notebook and you have your own end-to-end report in an afternoon. GENESIS is a gold mine: population, labour market, energy, prices, foreign trade, construction, healthcare, agriculture, tax, transport — there is something relevant for every company. Use this demo as the template, point it at the stats that matter for your business, and ship.
Your turn — contribute your solution
The Fabric Jumpstart catalog is a community effort, and this demo is my contribution. Big thanks to Miles Cole for the guidance that got Hochschul-Insights into the catalog — the whole process was smooth because of it. If you have built something end-to-end on Fabric, package it as a Jumpstart so anyone can install it in a single line. So: when will you contribute your solution?
Get it
Fabric Jumpstart (one-line install): jumpstart.fabric.microsoft.com/catalog/hochschul-insights
Source repo: github.com/KornAlexander/hochschul-insights
Data licence (DESTATIS GENESIS): Datenlizenz Deutschland 2.0 — commercial use OK with attribution.